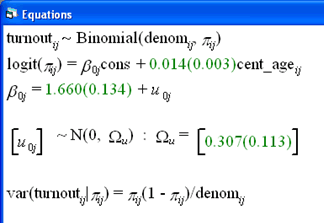
Now we extend the model to include an explanatory variable -age, which has been centred around its mean. This is Model 3.


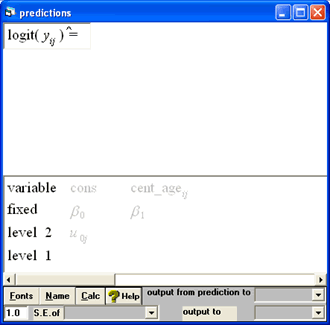
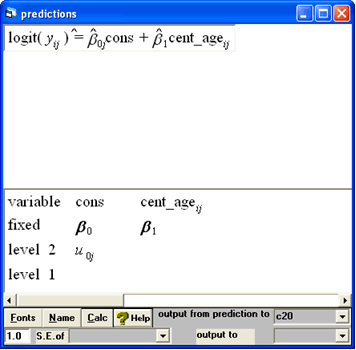
We now see that age has a positive coefficient (0.014) which is statistically significant (i.e. more than twice its standard error which is shown in brackets after the estimate and in this case is 0.003). A rule of thumb is to compare twice the standard error with the absolute (ignore sign) value of the coefficient. To do this exactly we would use 1.96 standard errors but as 1.96 is close to two it is a useful approximation to simply double it. As we can see 0.14 > 0.006 so this coefficient is statistically significant. As people get older they are more likely to vote. There is still considerable variation between countries (0.307). Conditional on knowing the age of each person in the model, so age does not explain all the country level variation in voting. We could produce a caterpillar plot of the residuals as before but we will now produce another kind of plot - one showing the predicted values. Choose model > predictions

 ,
, and
and 


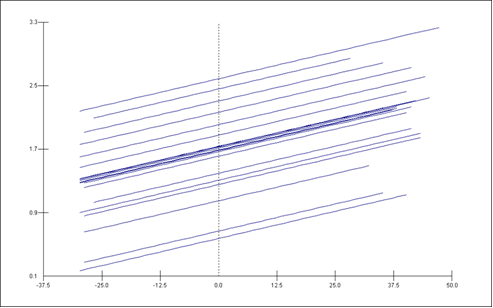
We now see a graph with 20 parallel lines -the gradient is positive. As people get older they are more likely to vote. On the centred age scale, 0 represents the average value of age -around 47. We can see that there is variation in terms of where the lines cross the vertical line at x=0; a linear effect of age does not explain all the country level variations in voting.