Select Insert > Function from the menu bar and choose COUNT from the Select a Function box:
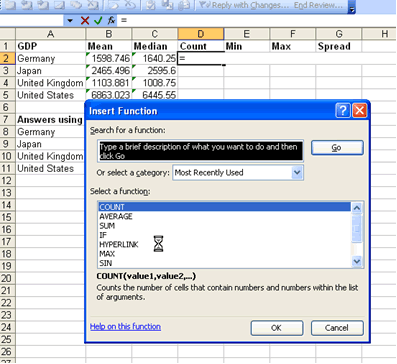
Click OK and the Function Arguments box appears. Leave this box open and go back to the OECD Factbook data download sheet using the tabs at the bottom of the page. Select the values for German GDP as before, and click OK in the Functions Argument box. Repeat the process for Japan, US and the UK. The count for all the series should be the same, i.e. 26. Carrying out a count is a basic way to check for missing values, that the data has been entered correctly, and that you are working with the same time series for your different countries.
Complete the Min and Max columns using the techniques you have learned above and the MIN and MAX functions in Excel.
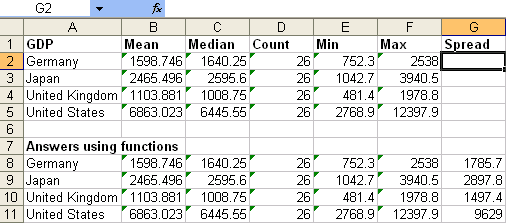
The final column in the summary statistics section is looking at the spread of values within each series i.e. the maximum value less the minimum. Rather than use a function, we are going to compute this directly by subtracting the value in the Min column from the value in the Max column.
Select the Germany Spread cell (G2) and enter the formula: =F2-E2
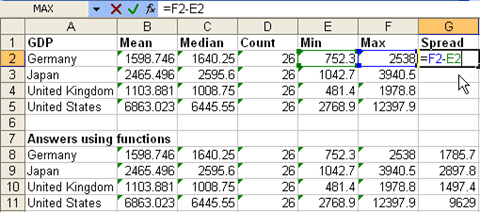
Press return, and the value 1785.7 pastes itself in. To copy the formula into the other Spread cells, hover over the bottom left hand corner of the G2 cell until the cursor turns into a black cross (the fill handle), then

Using the left mouse button, drag the cursor down over the remaining spread cells.
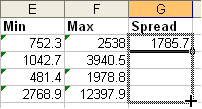
This pastes the same relative formula e.g. F3-E3, F4-E4 etc into the selected cells.
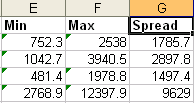
Take a look at your summary statistics results:
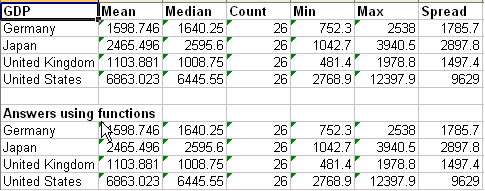
Summary statistics provide some basic checks on the data you are working with and give you important information about your dataset. The mean and median tell you something about the typical values or central tendency of the data. For example, it is clear from this task that the United States GDP surpasses that of the other three large economies combined. The means and medians for each country are also fairly similar. This tells you that the data is not skewed but has a reasonably even distribution about the average values. If the counts were different between the series, it would alert you to the fact that you had some missing data or were perhaps comparing different series! Here they are all the same, 26. The Min and Max values look reasonable and economically logical (e.g. no negative GDP values) and give you an idea of how dispersed the data are. These basic calculations can identify potential case outliers and are an important first set in any statistical analysis.