Mapping a Set of Points in MapShore
For this example, we shall use MapShore software that is supplied with SASPAC to map point data. First,
we need to get the coordinates into a format which the mapping program is capable of interpreting and
importing. MapShore can accept two types of point data file: its native Map91 format (.SYM) and a
standard comma delimited text file (.CSV). For simplicity the CSV format will be used in this example .
Each line of the CSV file should have a pair of easting and northing coordinates plus at least one
additional field. A maximum of eight non-positional fields is allowed and one of them can be the
filename of an image in either BMP or JPG format. The data fields in each line should be ordered
consistently and separated by a comma as in the following example.
"BT161SZ",4,2,547000,175600
"BT161SY",4,2,547097,175619
"BT162BD",3,0,546832,175587
It is important to note that the point data file should not contain any header row at the beginning. The
data composition and sequence can only be described to MapShore through a Setup (.SET) file which is
created on the first occasion that the CSV file is imported into MapShore. The SET file should be saved
at the same location and have the same filename as the CSV file. Additionally, the SET file enables the
user to define the format of the easting and northing (4, 5 or 6 digits) and filtering options using
Boolean expressions.
Preparing Point and Boundary Data
To complete the work in this example, you will need to click [here]
to download
.zip.
Save the file and unzip its content to a local folder. The point data are stored in "
.csv" which is a CSV text file. The associated point setup file shares the same name but is with
the SET extension as "
.set". It is necessary for MapShore to have the associated boundary data in order to know where to
map the point data. For those who have the full licence for SASPAC, you will find the MapShore Boundary
(.BDY) data available in the program installation media or from the SASPAC helpdesk (info@saspac.org). Other common GIS data exchange formats such
as MapInfo Interchange Format (.MIF) and ArcGIS Shape (.SHP) are also accepted by MapShore and can be
obtained by UK academic users from the UKBORDERS service. For use in this example, a sample boundary
data file ("
.SHP") is supplied in the zip archive.
Retrieving Boundary Data and Mapping Point data in MapShore
If running MapShore in association with SASPAC, start SASPAC. Choose "Start MapShore" and then
click OK if the Quickstart task menu is displayed otherwise select File > Run MAPSHORE. MapShore may
also be run independently.
When the MapShore window appears, select Boundary > Retrieve... to import the police beat areas
boundary data. Navigate to the location where the boundary data is saved and open the file. Make sure
that the Files of type: is set to the Shape File Format (.SHP).
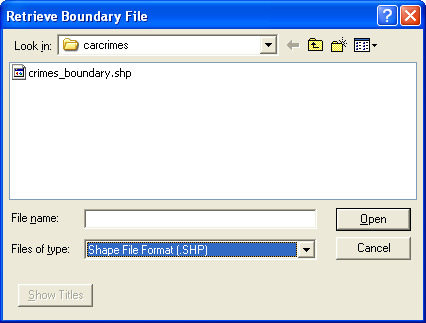
Click the "ZONEID" label and then OK to make it the area ID. After that you will be prompted to
choose area name, click "ZLABEL" and then OK.
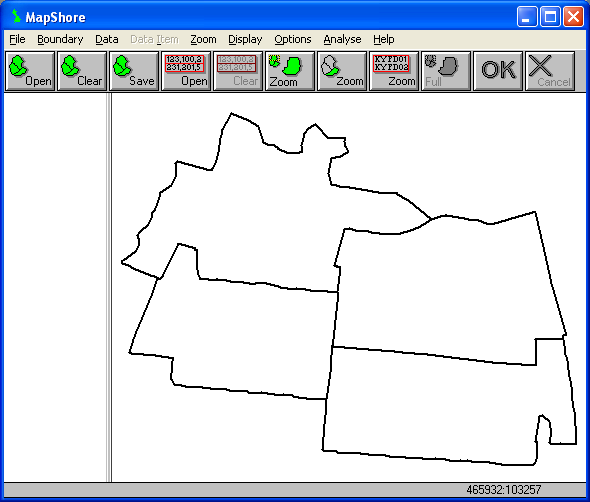
The boundary data are used by MapShore to set the areal extent for mapping the point data file.
Select Data > Retrieve Point Data... to add point data to MapShore. Make sure that the Files of type: is
set to the "Map91 Point Data File (.CSV)" before choosing the "
.csv" point data file.
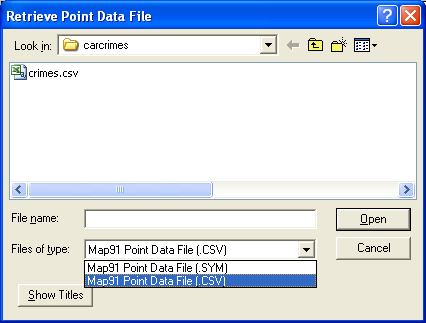
Click the "Open" button to open the point data file. In the "Select Symbol" dialog box, select
an appropriate symbol for your map. The colour of the symbol can be changed afterwards via Options >
Colours > Set Symbol Colours... As there is already a SET file, the Point Data Filter dialog box will
appear. This is useful if the user want to show a subset of data based on certain conditions e.g. number
and category of
etc. The aspect of displaying attributes will be discussed in the next section. For now we will focus on
mapping the location of the data so ignore the filtering options and click OK to continue. The spots
where crime was reported should now appear. You can use the zooming commands in order to examine the
results more closely.
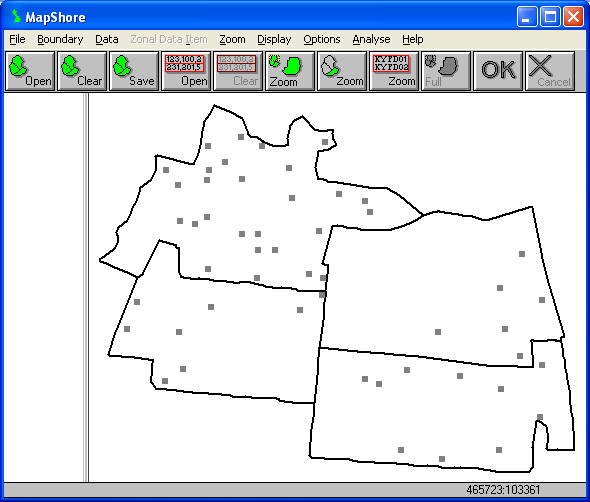
The results can now be exported as an image file in the Windows MetaFile (.WMF) format. Alternatively,
the print command will allow printing or saving the output (with a choice of low or high resolution) to
a BMP or JPG file. In all cases, you should save the work to a MapShore Library (.LIB) file for use in
the future. If you intend to carry on with the example below, close both MapShore and SASPAC now.
Adding Point-based attribute data in MapShore
Sometimes it may be necessary to map attribute data to point locations. For example, the
data used above may contain an additional data field to indicate whether the fire and rescue service has
attended each crime incident. In this case, the data will have any additional numeric field to register
the number of times the fire and rescue service is called.
Launch MapShore either independently or through SASPAC using the File > RUN MAPSHORE command
sequence.
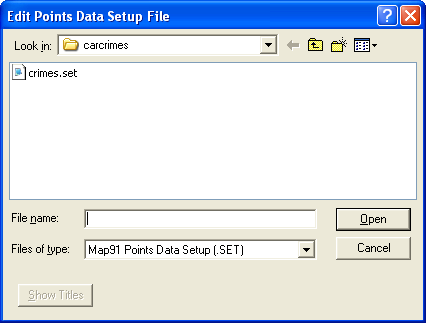
In the MapShore window, select Data > Edit Point Data Setup File... to define the characteristics of
the additional attribute data in the new point data file which is to be imported. Navigate to the
location where all the other data files are and open the associated SET file ("
.set") .
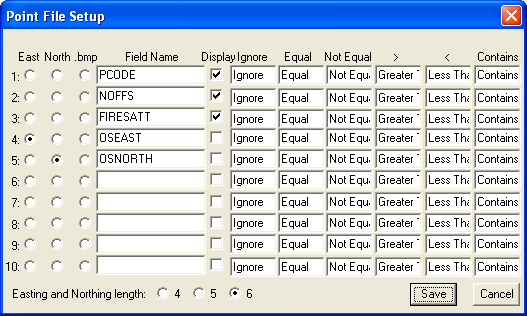
The Point File Setup dialog box will appear. Up to ten fields can be stored in the setup file. The Field
Name column contains the field labels for each record for the
data file provided in this example. Five data fields are currently included in the point setup file:
"ID", "NOFFS" (number of offences), "FIRESATT" (fires attended), "OSEAST"
(eastings) and "OSNORTH" (northings). Click the Display checkboxes for the "FIRESATT"
field so that this can be displayed on the map. Note that the East and North radio buttons are used to
indicate the data for eastings and northings respectively. Their length should be set to "6"
in most cases. Also important to note is that the eastings and northings fields should be placed at the
last two columns in the input data file.
Accept the remaining default values. Click Save to update the point data setup file.
Select Boundary > Retrieve... to insert the boundary file ("police_beats.shp") as we have
previously done. Make sure that the Files of type: is set to the "Shape File Format (.SHP)"
and proceed as before. The boundary data should now appear.
Now select Data > Retrieve Point Data... and open "
.csv". Choose an appropriate symbol to represent crime spots where no fire and rescue service has been
called ("FIRESATT" = 0). In the Point Data Filter dialog box, choose "Equal" from
the dropdown menu and enter "0" in the box for the "FIRESATT" field.
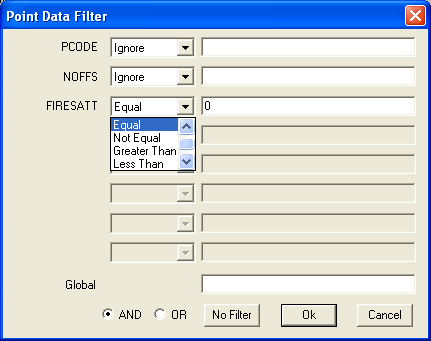
Click Ok and the crime spots without fire and rescue service attendances should now be mapped.

Retrieve the same point data file ("
.csv") again. Use a different point symbol and alter the filter option so that the value for the "FIRESATT"
field is now greater than 0. The remaining crime spots which have been attended by the fire and rescue
service should be added to the existing map as below.

The results can now be exported using the Export or Print commands. Save the work to a MapShore Library
(.LIB) file for use in the future.
Copyright Attribution
The Small Area Statistics Package (SASPAC) software is owned by the Improvement and Development Agency
for Local Government (IDeA). MapShore is a registered trademark of Pebbleshore Ltd. The software screen
shots shown in this page are reprinted with permission from IDeA and Pebbleshore Ltd. The maps shown
above are based on data provided through EDINA UKBORDERS with the support of the ESRC and JISC and uses
boundary material which is copyright of the Crown.

 Homepage
  Geographical Referencing Learning Resources


